Disclosure: I am long
LF.
(More...)
Introduction
Leapfrog (
LF) is an international educational toy maker that has recently gained acclaim for the success of its flagships product, the LeapPad. There is significant negative sentiment surrounding Leapfrog as an investment due to the significant industry competition, coupled with dependence upon one product, and the inconsistent historical performance. These concerns appear overstated and ignore the company's other strengths. Leapfrog has received consistently better third part reviews and created a more defined niche than competitors. Long term growth can be supported by taking advantage of just some of the industry wide and company specific opportunities facing the company. Leapfrog is now in control of operating expenses, fueling profitability; and there is room for further improvement. Leapfrog balance sheet is quite strong with monetizable assets worth between 30% and 40% of the market cap. A DCF model illustrates a significant margin of safety and upside that could be higher, as the company is ripe for a buyout. Finally, there are numerous catalysts upcoming catalysts for realization of value. Leapfrog currently represents a strong buying opportunity.
Background
Leapfrog produces content, toys and hardware all designed to deliver entertainment and education. The company sells toys aimed at the younger end of its target audience at lower to gain long-term customers. Leapfrog has recently made a push into content. According to the recent investor
presentation, Leapfrog has gone from just over 100 games and books in 2010 to over 500 books games, apps and music products in 2012. This growth has been partly fueled by partnerships with leading entertainment companies such as Disney and most recently
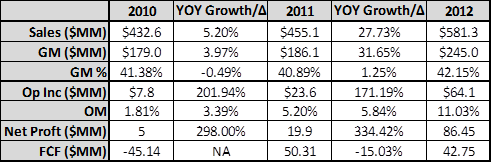
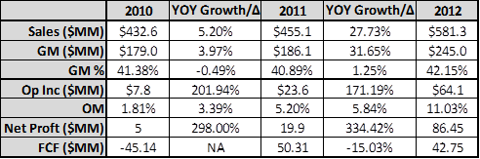
Lionsgate. Leapfrog is most known for the introduction of the kid's educational tablet, the LeapPad, which has received critical acclaim, sold very well, and provided the conduit for the company's content. The LeapPad has driven significantly improved results:
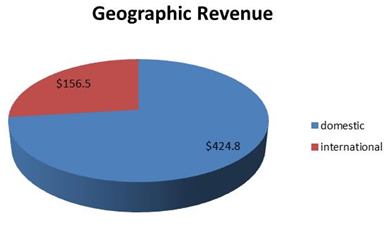
The company has benefited from international expansion, due to the desire for to learn English, and native language educational toys, reflected by the company's introduction of a French LeapPad. The international segment grew 28% and 38% in 2011 and 2012 respectively. The current breakdown of international vs. domestic revenue is below:
Yet there are some legitimate concerns about the company, which have become the cornerstones of the large short
position of the stock which currently is about 14.5MM shares, compared to the company's fully diluted share count of approximately 69MM, according to the company's most recent
10-K. First amongst these concerns is the competitive landscape centered around the LeapPad. While it is unlikely behemoths like Apple or Google enter this market because they look for bigger opportunities, there is still currently many other competing tablets. These tablets are made by larger manufacturers with economies of scale, and boast greater performance specs. Additionally, Leapfrog holds relatively few patents (none mentioned in company's 150 page investor presentation). Current and future competitors could easily replicate the product as there are few barriers to entry. Additionally, major toy companies such as Hasbro and Mattel have yet to flex their muscles in this market. This situation is particularly precarious for Leapfrog because it is dependent upon this product line, past products have had short lifespans, and management has had difficulty controlling costs. Upon deeper analysis, however, these concerns appear overblown largely because Leapfrog's position is stronger than it appears at first glance, and Leapfrog has numerous opportunities to overcome the effects of successful competition.
Competitive Position
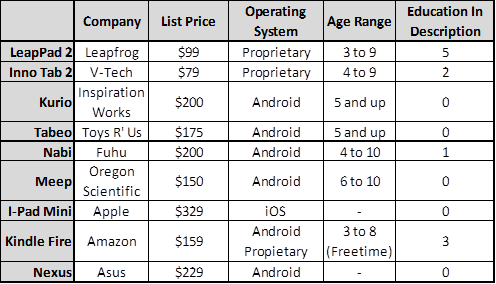
Since the LeapPad is integral to the company's success it is appropriate to examine its main competitors. The children's tablet market has more competitors of a variety of scales and functionalities, than the full feature tablet market. Key competitors to the LeapPad can be summarized by the following table with a basic description of features:
Source: amazon.com and toysrus.com (when unavailable on amazon)
The last 3 entries are full feature tablets that could be used for kids, but are not designed for them. The LeapPad has differentiated itself more than any other competitor has. The LeapPad's only competitor on price is the Inno Tab 2, as other offerings are at least 50% more. It also is aimed at the youngest segment of all competitors. Finally, it objectively has a much greater emphasis on education than other offerings. The LeapPad has created a unique niche in comparison to competitors as it is almost a monopolistic offering in the young children education market. There is significantly more competition along the variables of "entertainment" and for older children. Furthermore, the low price point allows it to capture demand outside of its direct market..
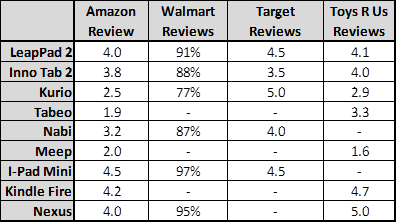
Potentially more significant is the table summarizing consumer reviews of these products.
The LeapPad 2 is rated consistently higher than all other tablets designed for kids, which combined with its attractive price point, indicates LeapPad demand in the near future. The strength of the LeapPad 2 reviews are further supported by the numerous positive third party
reviews. These reviews are not unexpected as the company invests significantly in R&D and employs many people with higher degrees to constantly improve its offerings. While no one can predict the strength of Leapfrog's products in 3 to 5 years, the above strength combined with the company's emphasis on development indicates a high relative probability that it remains a major player in this market. This is further supported by the numerous poor reviews of children's tablets, indicating that product replication may not be simple.
Full feature tablets receive greater reviews than the LeapPad, and should because they are inherently superior products. However, these reviews are not for their use with children. The LeapPad is designed specifically for kids, with features such as a bumper, parental controls, and age appropriate content. While competitors, in particular the Kindle Fire with its low price point and access to content, could pose a threat, the LeapPad's position appears relatively safe because it is specifically focused on children.
Growth Opportunities
Leapfrog is poised to take advantage of numerous industry wide trends. The tablet market is rapidly expanding, and estimates include for tablet market growth are
28%,
19%, and
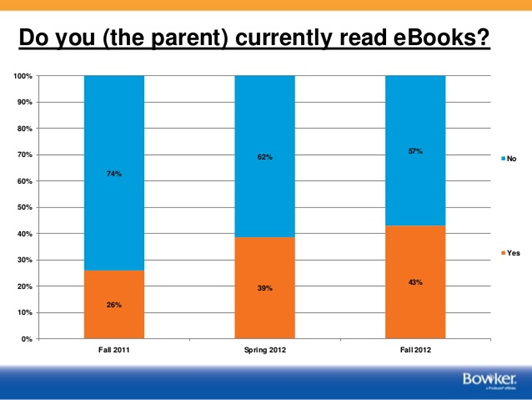
22%. While the children's tablet market is inherently different than the overall tablet market these figures bode well for LeapPad. As tablets proliferate to parents, children may demand their own. These figures also suggest the strength of the general tablet platform, indicating opportunities by application in the children's market. Leapfrog is poised to take advantage of the shift to digital media. Telling charts comes from
Bowker:
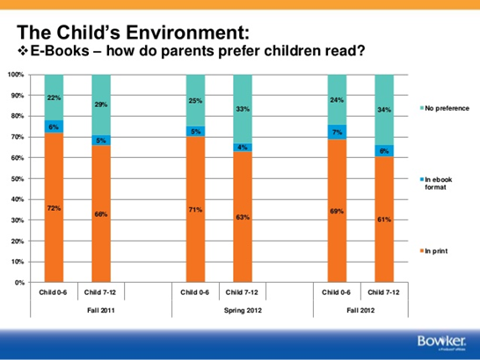

As parents become more comfortable with e-books they will likely purchase more digital content, and kids follow parents. The first chart indicates that children are shifting towards digital content for media, and this shift has a long way to grow. The U.S. Children's Book
Market is already over $3B, indicating that a minor shift towards digital media could be significant for a smaller company such as Leapfrog.
More importantly, Leapfrog has plenty of company specific and tangible opportunities ahead. First among these is international expansion. The company cites in its investor day that it has 13MM parents connected in its online database. And yet there are 655MM children in primary schools around the globe. Asia may be particularly profitable, as households spend 15% of their budgets on supplemental education as opposed to the U.S., where households only spend 2% of revenue. Some regions prefer native educational products. Leapfrog has proven it can tap into these markets with the company's success with the French version of the LeapPad. According to the 4th quarter
transcript, Leapfrog sees "global expansion as another substantial growth opportunity…over the next few years, and in 2013 we will increase investment to localized products for new market expansion in 2014." Estimating a growth figure with all of these facts is difficult at best, but it is clear that international growth could be significant.
The company also has opportunities with its existing customer base and its content. Leapfrog has rapidly expanded its content, allowing it increase content sales by 50% yoy, and app sales by 300% yoy. Further growth should be supported by Leapfrog connect, which allows the company to easily market increased content to a growing customer base. Leapfrog Connect is also a huge asset for the company because it provides them unique feedback allowing them to keep up with demand.
Profit Growth
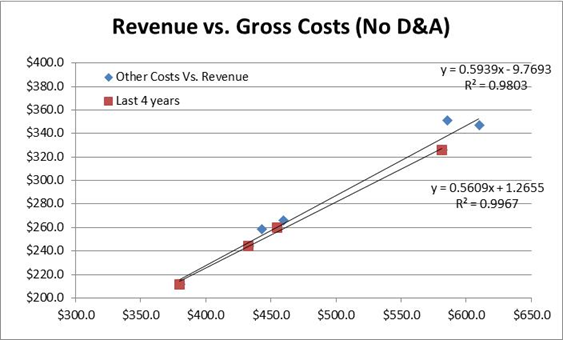
Bottom line growth will likely be supported by further operating efficiencies. Margin expansion will not likely occur at the gross level as illustrated by the following chart of gross costs, after removing D&A attributable to gross costs:
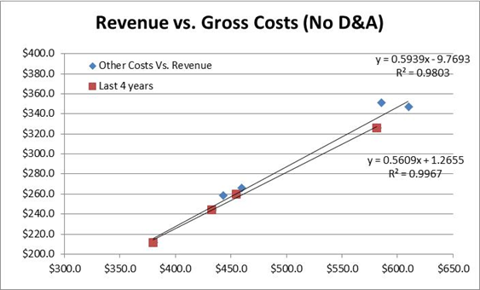
The above indicates that the company is achieving relatively little economies of scale on the gross level. A significant outlier (2006) was removed to observe the trend. Also for future modeling purposes the trend line for the last 4 years was used as opposed all 8 data points because every single data point from the last 4 years lied on or below the trend line for all data points, indicating a change for more recent results. This also indicates that Leapfrog has maintained constant margins over a long time period producing very distinct products.
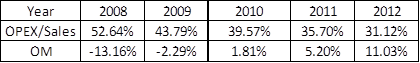
Reductions in operating expenses have been the main driver of the company's rise in profitability, which can be illustrated by the following chart:
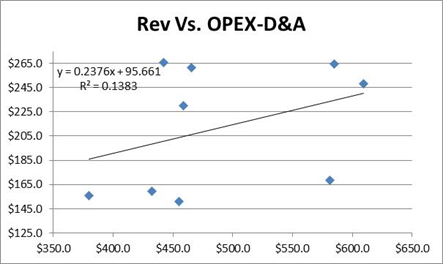
Leapfrog's operating costs are unique; leverage of fixed costs such as warehouse expenses is almost nonexistent. This can be illustrated by the following graph:
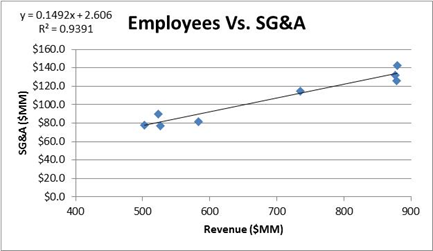
Rather, operating expenses are driven primarily by employee count, illustrated by the 3 following graphs of its major operating expenses vs. average employee count for the year.
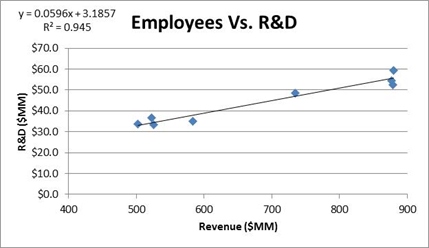
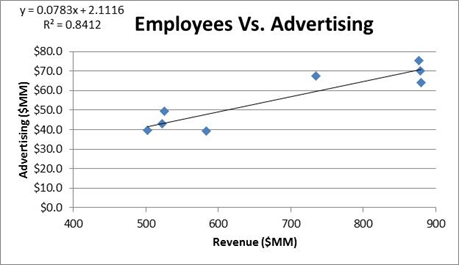
This company's employee levels have fallen from 916 at the end of 2006, to 552 currently, and were even lower at the end of 2011 at 494. It is clear that the company
was poorly managed, but the major change in employee levels indicate management has likely learned from its mistakes. In fact the company stated in its
analyst day, ""LeapFrog did have its ups and downs, but I can tell you that cost control is a major area of focus for us and we are not going to grow our infrastructure faster than we're growing the rest of our business." Leapfrog has nearly complete control over employee levels and should be able to maintain if not improve cost on this level. As the company achieves network effects with the proliferation of hardware and growth of Leapfrog Connect, an incremental product generated by an employee will be able to achieve greater sales. This may explain the company's statement in the 4th quarter call that content has higher margins than hardware. While the company has guided for constant operating margin moving forward, good management of employee levels could allow for further relative decreases in operating costs.
Balance Sheet Analysis
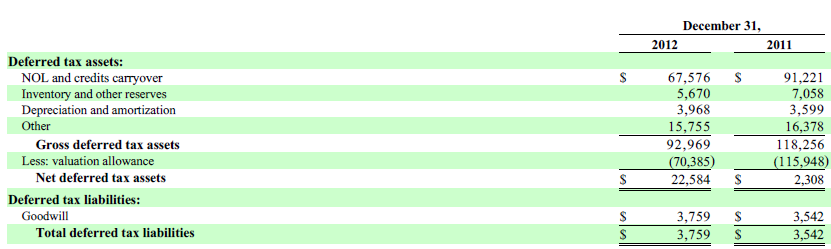
The company's net operating losses (NOLs) will also boost the company's cash flow in the future. Leapfrog believes it will not "pay any significant amount of US federal taxes in the next several years." (4th quarter transcript). This is clearly valuable yet the NOLs are not listed on the company's balance sheet. Rather they are listed in section 10 of notes in the company's 10-K. The company currently only values them at $22.6MM due to a $70.4MM valuation allowance.
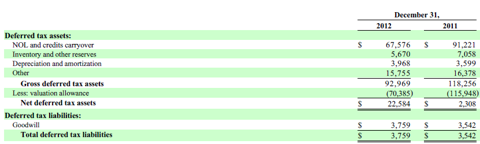
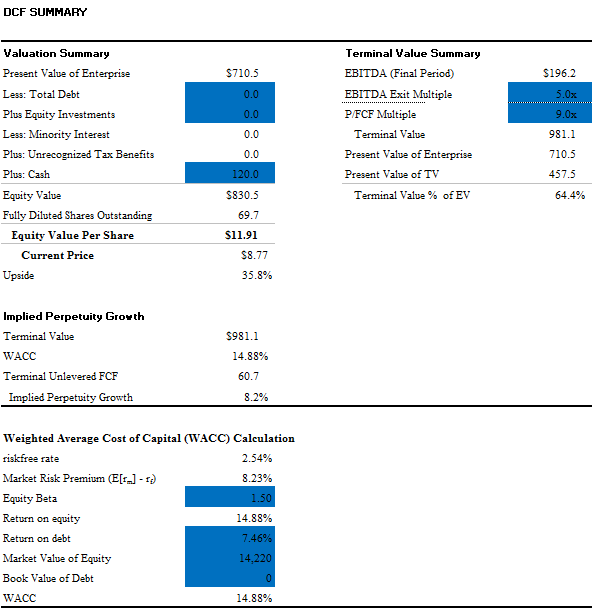
Leapfrog is predicting profitability this year, which will likely continue into the following year. Unless the company's tax rate is inordinately small, it will use the NOLs as soon as possible to maximize their value. To determine a realistic value, the DCF model was run at the base case with and without the federal and state NOLs of $140.4MM and $178.5MM at the appropriate rates. The difference in entity value was approximately $50MM. This estimate is likely conservative because the gross deferred tax asset value is $93MM in its 10-K, and the DCF did not include tax assets as research credits, whose correct application could not be determined.
Additionally, LF has $120MM in cash and no debt on its balance sheet. These two assets at a minimum are worth $170MM and could be worth up to $210MM.
Valuation Metrics
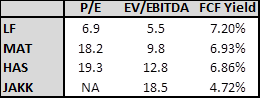
The company's relative valuation can be summarized by the following chart:
P/E is deceiving for LF because of the effect of valuation releases. Still, LF is basically the cheapest on every metric, including FCF. Major industry players Hasbro (
HAS) and Mattel (
MAT) had at least slight positive changes in working capital, whereas LF was significantly negatively impacted ($-30.8MM). Toy makers usually are slightly negatively impacted each year by changes in working capital. After taking this into account, LF becomes much cheaper than competitors on a FCF yield basis.
Relative valuation is a poor metric for valuing LF. While HAS and MAT are toymakers, neither are major competitors in LF's line of business. These companies rely on concepts such as economies of scale, and brand name that LF does not have. So while LF and these companies compete for similar dollars from consumers, they have many different forces affecting them, and should not have similar multiples.
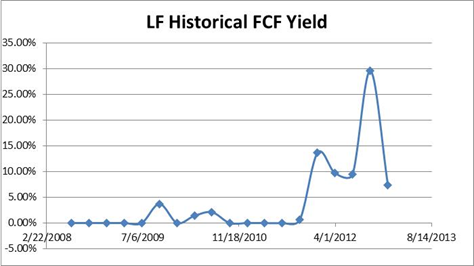
LF's historical FCF yield can be seen in the graph below:
Negative values are displayed as 0 for simplicity. Historical FCF data is not revealing because the company had negative FCF for sometime, and there is not enough meaningful data.
DCF
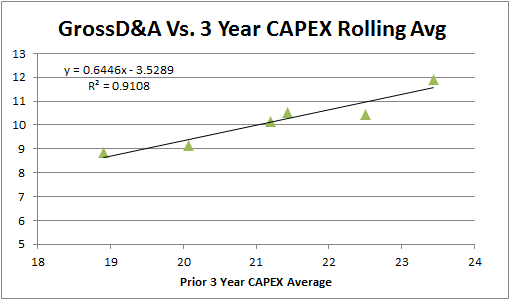
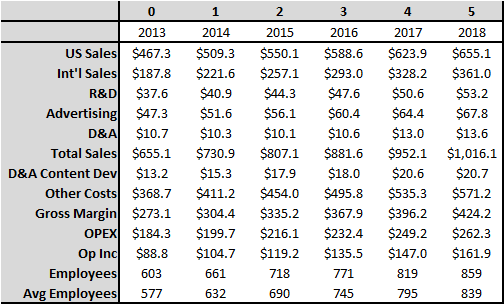
A DCF is the only way to value Leapfrog given lack of insight provided by historical and relative figures. The DCF began with a revenue model that split sales into U.S. and international segments. Gross costs outside of D&A were predicted using the graph displayed earlier. Gross D&A costs were predicted using a relationship with average 3 year CAPEX, which can be seen in the appendix. OPEX of advertising, SG&A and R&D was determined through the aforementioned relationships based upon employee levels, which were predicted as a ratio of sales/employee. Operating D&A was conservatively predicted to minimize the tax shield.
Taxes were applied each year at the 35% federal and 4% state rates. NOLs reduced taxes when they were available. WC was conservatively modeled as 23% of sales per year when the company has WC = 22% of sales over the past 4 years. Other income was not included in the model because this was small and tied to currency changes. Charges from stock compensation were not added back because these dilute shareholders. Doubtful accounts were not added back to be conservative.
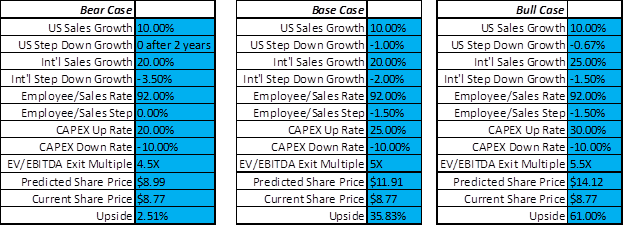
The bear case represents a scenario in which the LeapPad stagnates causing U.S. growth to be zero after 2 years, and international growth decreases more quickly than the base case. This prevents further operating efficiencies through lower employment, and investors assign a lower multiple. In the base case Leapfrog achieves solid but slowing growth with a slight ability to decrease operating expenses and a constant multiple. For the bull case the international segment experiences significant growth, U.S growth steps down a little slower and the market assigns a slightly higher multiple. The key assumptions and values for these cases are summarized below.
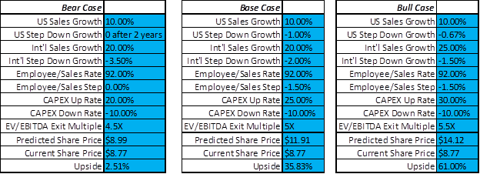
The bull case is important because it illustrates that there is significant upside to the company in a feasible scenario. The base and bear case are probably more important. The base is essentially taking company guidance and consistently diminishing results, showing that even with some slow down of the business there is noticeable upside. The bear case illustrates that the market is likely pricing in a situation in which almost none of the company's opportunities succeed and Leapfrog will be poorly managed. Overall, the market appears quite pessimistic, and these cases represent a positively skewed investment profile.
Risks And Weaknesses
In addition to the weaknesses mentioned in the short thesis, there are some other risks especially related to modeling. Beyond company guidance, there is little from which to base future periods. LF operates in a niche market which independent researchers do not examine. This is compounded by the historically short lifespans of company products. Additionally it is difficult to forecast operating expenses because they depend upon employee levels which depends upon the strength of management.
Revenue estimates in the base case may be more aggressive than what analysts are
predicting, judging from 2013 base case revenue. However, analysts are already predicting growth lower than company guidance for 2013 of high single digit growth and constant operating margin, but the company has historically under predicted. Furthermore, the company has significant room for revenue growth through its growing permanent customer basis and international opportunities. Since growth rates are noticeably lower than they have been the past 2 years. The slight expansion of operating margin over the time period is reasonable because employee levels still significantly increase. Employees per sales should slightly decrease each year as the company becomes slightly more efficient.
Buyout Possibilities
The DCF illustrates what Leapfrog is worth to itself. However, the company could be worth significantly more as a subsidiary of a major corporation. Major players like Hasbro and Mattel do not have exposure to this market which is growing, unlike the stagnant traditional toy market. Acquiring a company with a solid foundation could be much more efficient than developing the product line in house.
Much of the potential value is tied to Leapfrog's ability to reach a broader customer base, especially internationally and drive further operating efficiencies. A larger company has already established this infrastructure; if Leapfrog could use this as a subsidiary, they would experience fewer expansion costs and be much more likely to achieve top line growth. Leapfrog would also be able to significantly reduce certain operating expenditures under a larger company. Leapfrog would likely not reduce employees related to R&D as this has been the driving force of the company's success; but Leapfrog could now leverage vendors for better advertising deals, and use fewer employees for advertising and SG&A by taking advantage of the parent company's resources. Finally, Leapfrog may have had constant gross margin because of a lack of leverage over suppliers; this could change with the clout of a larger company.
Determining an exact private market value is not possible; but it would command a significant premium to even suggested fair value because there are significant operating synergies.
Catalysts
Not only does LF appear to have significant value, there are significant upcoming events that should allow investors to realize this value.
As mentioned the company has a large cash position. The deployment of these reserves through an acquisition could illustrate predicted future strength by management. Use of these reserves for shareholders could make investors realize management is shareholders are friendly.
The company is scheduled to debut a new reading system soon and a new LeapPad and associated offerings in June. Positive reception here could push shares higher.
The company has already stated that it plans significant international expansion in 2014 and success in that year would benefit shareholders. However, investors could be rewarded earlier with positive reports on international expansion.
The model currently predicts LF will exceed analysts estimates. Even though there are uncertainties to the model, there would have to be significant changes for analyst estimates to be missed. Additionally, it appears that analysts are predicting results on the low side of company guidance and LF has over the past couple of years under predicted results. These results could be aided by the company's shift to more content, which would make for a more stable operation that is less dependent upon seasonal success.
Finally, all of these issues could be compounded by shorts covering. LF has about 14.5MM shares short out about 69MM which represents almost 21%. If results are positive there could be a significant short squeeze.
Appendix