
Friday, May 31, 2013
Thursday, May 23, 2013
Applying A Valuation To Sirius XM
http://seekingalpha.com/article/1455881-applying-a-valuation-to-sirius-xm?source=feed
Applying A Valuation To Sirius XM
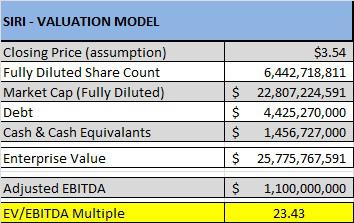
With Sirius XM's (SIRI) recently added debt, the rise in the stock price, and the shrinking of the share count via a share buyback program, it is perhaps a good time to explore the current valuation of Sirius XM. While there are many ways to value a company I like to use the EV/EBITDA method because Sirius XM is a media company and media companies tend to be valued on their EBITDA growth and free cash flow growth.
(click to enlarge)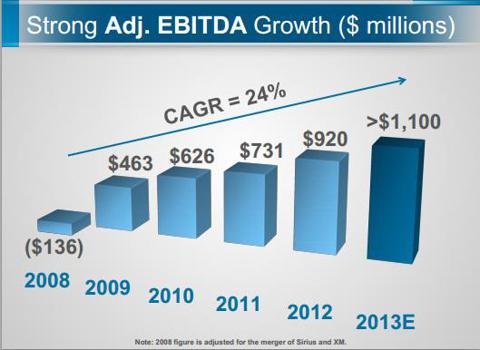
The EV/EBITDA method is obtained by taking the Enterprise value and dividing it by EBITDA. Enterprise Value is the Market Cap + Debt - Cash. EBITDA is the earnings before interest, taxes, depreciation, and amortization. Historically, Sirius XM has traded at a multiple of between 17 (on the low side) and 24 (on the high side). As the components of the formula change, the multiple will change as well. Usually the component that moves is simply the share price. Debt issues arise from time to time, and share count can change from time to time.
Recently we have seen all facets of Enterprise Value change. The company added a $1.25 billion dollar credit facility, had two $500 million dollar debt issues (total of $1 billion), has bought back 209 million shares, and of course, the price of the equity changes daily. With all of these moving parts, assessing an exact valuation is difficult. For the time being, the company will not be issuing more debt, so one moving part has settled down. The company will continue with share buybacks, but we do not know the rate at which these are happening. Simply stated, we need to make some assumptions.
This brings us to the concept of outlining the components of obtaining an EV/EBITDA valuation.
- We use the current share price and the share count in the last company filing to obtain the market cap.
- I count the credit facility as if it has been drawn upon. This adds $1.25 billion to the cash column as well as the debt column.
- I use current company EBITDA guidance of $1.1 billion. When the company updates this guidance for next year, the EBITDA assumption can be adjusted. If you are interested in looking at a longer term with other assumptions, simply assume 2014 EBITDA at about 28% growth. This would make the assumption for next year at $1.4 billion.
In my model you will see that the current multiple sits at about 22.91. That is at the high end of the multiple range that Sirius XM typically traded in. The high level multiple of 24 would be attained if the equity gets to $3.73. This is a few cents away from my "reasonable" target for the year. My high end target (a level the equity may touch and retreat from) is $4.25.
Heading into the doldrums of summer, we may see this equity reach impressive levels on the fact that the company, via share buybacks, is supporting the price of the stock. I anticipate that the company will go well beyond the $2 billion that it committed to buybacks and this support dynamic will continue to exist. In fact, I believe that once Liberty Media (LMCA) begins to participate in these buybacks that the news will be more publicly known, as Liberty Media would want to sell its shares at as high a price as possible.
While share buybacks are happening, I believe that there is a distinct possibility that this company can touch EV/EBITDA multiple of 27 under the right conditions. Further, as 2012 passes, and it becomes clear that Sirius XM is hitting EBITDA targets, the market will begin to make assumptions regarding future EBITDA and thus allow a higher valuation.
Simply stated, there is justification for the current trading levels based on the historical multiples that this equity has traded at. There is justification for appreciation from here due to strong company performance and a better macro-economic environment. Lastly, the share buyback dynamic is yet another justification for a higher valuation.
I see Sirius XM as a buy on virtually any dip. I think the realistic price goal is currently about $3.75 with spikes to $4.25. Big news, such as an announced increase in the share buyback program can move this even further. As the quarters of 2012 pass and current guidance seems more and more real, the confidence of trading at, and maintaining, higher multiples will become easier for the street to digest. Stay Tuned.
Thursday, May 16, 2013
「克強指數」
大行料華經濟難「保八」
四月份內地經濟數據未如理想,外資行相繼調低今年中國經濟增長預測,當中摩根大通首席中國經濟學家朱海濱將今年增長預測,由原來7.8%調低至7.6%;美銀美林則由原來8%調低至7.6%,明年僅持平;ING更將由之前9%「狂劈」1.2個百分點至7.8%。
「克強指數」續處弱勢
國務院總理李克強任職遼寧省委書記時,喜歡參考工業用電量、中長期信貸餘額,以及鐵路貨運量這三個指標,來分析當時遼寧省經濟狀況。海通證券根據這三個指標繪製最新的「克強指數」走勢圖,發現今年以來指數持續下滑,前兩個月為6.12,三月份降至4.41,雖然四月反彈至5.17,但鐵路貨運量顯著下滑,情況反映貨幣空轉還在延續,貨幣信貸進入實體經濟「偏慢偏弱」,並且上游生產資料價格出現反季節下跌,料未來工業生產仍疲弱。
摩根大通今年第二度調低中國經濟增速預期,指有迹象顯示需求不振且製造業疲態正向服務業蔓延。美銀美林調低今年內地經濟增長預測0.4個百分點,原因是上月數據遜預期、外圍需求疲弱,以及基數效應。該行又認為內地新領導班子不介意經濟增長低於8%,料人行不會減息。
挖掘“克強指數”中的市場元素
“克強指數”是英國政經雜誌《經濟學人》創造的用於評估中國GDP增長量的指標,它的核心內容是工業用電量、中長期信貸餘額和鐵路貨運量三個基本指標。
雖然這是李克強總理在擔任遼寧省委書記時喜歡採用的考量方式,且主要是用於評價和考核遼寧的經濟發展狀況。但是,當《經濟學人》于2010年底正式推出這一指數後,還是受到了包括花旗銀行在內的眾多國際機構的一致認可。
也許有人會説,雖然三大指標都是衡量經濟發展水準的剛性指標,可以比較準確地判斷經濟發展水準和經濟運行狀況。但是,也存在諸多缺陷。如用電量指標,如果一味地考核用電量情況,並以此考量經濟運行情況與水準,就會帶來節能降耗指標的難以完成,並造成社會資源的巨大浪費。再如中長期信貸餘額指標,如果過度考量,就會造成固定資産投資過熱,並帶來重復投資現象難以控制。
顯然,這是對三大指標過於機械、僵化、教條地理解的結果。事實上,三大指標都是市場化內涵很深的指標,都有許多可以挖掘的市場元素。特別是在經濟結構調整與轉型、經濟增長方式轉變的關鍵時期,三大剛性指標的市場要求更高,需要挖掘與消化的市場元素、市場矛盾也更多。
以用電量指標為例,從表面看,用電量反映的只是經濟的活躍度以及工廠的開工率,實際上,它還反映了企業的創新能力和市場適應能力。因為,只有開工生産,而沒有技術創新和生産成本的控制,特別是節能降耗方面的具體措施與辦法。縱然開工良好,企業也難以擺脫困境。只有那些真正致力於技術創新、産品結構轉型、成本控制的企業,才會有市場競爭力、特別是核心競爭力。所以,用電量所考量的,就不僅僅是數量,還有品質,且品質比數量更重要。一旦實現用電數量和品質的統一,用電量指標就能夠真正成為衡量經濟發展水準的重要指標。顯然,按照目前李克強總理反復強調的簡政放權、簡化審批要求,用最量指標也被賦予了更多市場元素和內涵。
再以中長期貸款餘額為例,這項指標所反映的最核心內容就是投資,而投資又分生産性投資與非生産性投資兩種。生産性投資的功能作用是增強貸款的活躍度和有效性,貸款之水不會越來越死。相反,非生産性投資由於投入産出效益很低。一般情況下,貸款的活躍度和有效性是很低的,貸款之水也是越來越死的。如果貸款中非生産性投資的比重過高,經濟就很難活躍,抗風險能力也很弱。目前出現的情況,就是近幾年來非生産性投資、特別是政府性投資過猛的結果。
也正因為如此,李克強總理在近日召開的國務院機構職能轉變動員電視電話會議上表示,要實現今年發展的預期目標,靠刺激政策、政府直接投資,空間已不大,還必須依靠市場機制。把該放的權力放到位,激發各類市場主體發展活力和創造力。什麼是市場機制,什麼是市場主體,不就是企業和民間投資嗎?如果這一活力得到激發,生産性投資不就會成為社會投資的主力軍嗎?
如果若干年前的“克強指數”,可能主要還是以數量為考量標準的話,而從近年來李克強總理在不同場合的講話來看,品質已是“克強指數”更加重要的內容。其中,如何突出市場特性、運用市場機制、強化市場主體的作用,減少政府對經濟和企業的干預,則是最核心、最基本的內容。
所以,對“克強指數”的理解和把握,應當更多的看到其市場內涵、挖掘市場元素,而不要過度看重其表面特徵、數量特徵。只有這樣,“克強指數”才能更加準確、有效地反映中國經濟發展水準、中國經濟結構調整與轉型、經濟增長方式轉變的成果。
而從近一段時間的情況來看,透過“克強指數”所反映出來的中國經濟發展的問題,不僅表現在量上,更表現在質上,不僅表現為量的緩慢恢復,更表現在質的緩慢提升。特別是中長期貸款餘額,更多的是非生産性投資、特別是政府投資的快速積聚。其中,民間投資的等待觀望,是“克強指數”反映狀況不佳的最主要問題。
聯想到李克強總理一再強調的城鎮化建設發展思路,如果不能準確地認識城鎮化的發展目標和要求,不能站在市場化角度分析和研究問題,那麼,城鎮化之路就極有可能走偏,就極有可能被地方政府錯誤運用。這是必須引起高度重視與關注的問題。
總之,雖然“克強指數”誕生於若干年前,但隨著中國經濟轉型步伐的加快,其內涵也在發生著積極的變化,賦予“克強指數”更多的市場元素、努力挖掘“克強指數”中的市場元素,則是發揮“克強指數”對中國經濟發展衡量與評判作用的關鍵所在。
Sunday, May 12, 2013
10 Stocks To Profit From Emerging Market Consumer Sector Growth
http://seekingalpha.com/article/1427811-10-stocks-to-profit-from-emerging-market-consumer-sector-growth?source=feed
10 Stocks To Profit From Emerging Market Consumer Sector Growth
The consumer sector is growing strongly in many emerging countries. The explosive growth in the middle class coupled with rising income levels is fueling the sales of consumer goods. Countries such as Indonesia, India, Turkey, China, Brazil and even Russia are undergoing a major shift in the economy where the consumer is taking the center stage. Until recently, most of these countries were primarily considered as commodity producers or cheap locations for manufacturing. However, that is the not the case anymore as these countries transition to consumption-based economies. China is one classic example where consumption of goods and services is increasing. For example, China is now the largest auto market in the world. The Brazilian retail sector has experienced tremendous growth during president Lula da Silva's administration and continues to grow under the current leadership.
A recent article in Fidelity Viewpoints discussed about the Chinese economy's transition from investment-led to consumption-driven and some emerging market consumer stock picks. From the article:
In 2000, China produced about 10 million tons of steel each month. Last year, that number had grown to more that 60 million tons-a six-fold increase in a little more than a decade. The growth was dramatic, but it was also just one small example of how infrastructure construction drove demand for raw materials and helped shape the investment landscape in emerging markets during the last decade.But a massive shift is underway in China that could change that investment calculus. With many of the highways, skyscrapers, and ports now built, China is trying to navigate a shift from an infrastructure-led economy to a consumer-driven one. Add to that rising wages, and emerging-market investors may benefit by shifting focus from commodities to consumers.
Source: Can consumer stocks lead?, Fidelity Viewpoints, 5/8/13
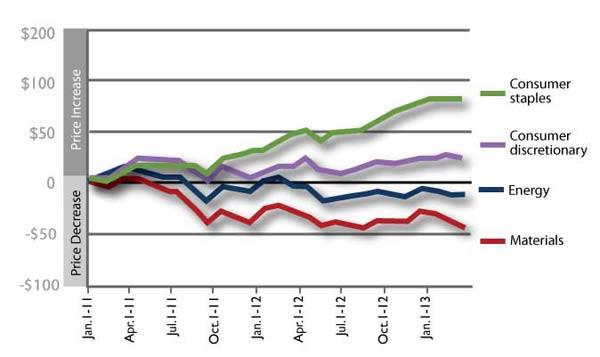
As China moves to a consumption-based economy with much of the basic infrastructure already built, the demand for commodities will decline. The Fidelity article noted that energy and materials make up more than 23% of the MSCI Emerging Markets Index. However these two sectors have been laggards in recent years relative to consumer staples and consumer discretionary sectors as shown in the chart below:
(click to enlarge)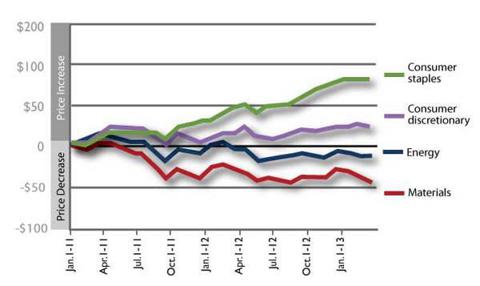
Some of the ways to profit from the growth in emerging market consumer sector are: invest directly in domestic companies operating in the sector, invest in Western multinationals which have a big presence in these countries with popular brands, invest via ETFs that focus on this sector, etc.
For investors who prefer to invest via individual stocks, the best option is go with developed stocks with high exposure to emerging markets. This way investors can avoid issues related to emerging companies such as accounting, lack of transparency, government ownership and control, majority ownership by powerful dynastic families is all too common in these countries, etc.
Ten Western multinationals with high exposure to emerging market consumer sector are listed below for consideration:
1. Company: Nestle SA (NSRGY.PK)
Current Dividend Yield: 3.12%
Sector: Food Products
Country: Switzerland
Current Dividend Yield: 3.12%
Sector: Food Products
Country: Switzerland
3. Company: Colgate-Palmolive Co. (CL)
Current Dividend Yield: 2.25%
Sector: Household Products
Country: U.S.A.
Current Dividend Yield: 2.25%
Sector: Household Products
Country: U.S.A.
4. Company:Procter & Gamble Co. (PG)
Current Dividend Yield: 3.05%
Sector: Household Products
Country: U.S.A.
Current Dividend Yield: 3.05%
Sector: Household Products
Country: U.S.A.
5. Company: British American Tobacco PLC (BTI)
Current Dividend Yield: 3.70%
Sector: Tobacco
Country: U.K.
Current Dividend Yield: 3.70%
Sector: Tobacco
Country: U.K.
6. Company: Adidas AG (ADDYY.PK)
Current Dividend Yield: 1.63%
Sector: Textiles, Apparel & Luxury Goods
Country: Germany
Current Dividend Yield: 1.63%
Sector: Textiles, Apparel & Luxury Goods
Country: Germany
8. Company: Henkel AG & Co KGaA (HENKY.PK)
Current Dividend Yield: 1.48%
Sector: Household Products
Country: Germany
Current Dividend Yield: 1.48%
Sector: Household Products
Country: Germany
9. Company: Heineken NV (HINKY.PK)
Current Dividend Yield: N/A
Sector: Beverages
Country: The Netherlands
Current Dividend Yield: N/A
Sector: Beverages
Country: The Netherlands
Related ETFs:
Disclosure: Long HENKY
Disclaimer: Dividend yields noted are as of May 10, 2013. Data is known to be accurate from sources used. Please use your own due diligence before making any investment decisions
Monday, May 6, 2013
證監加強規範專業投資者
http://orientaldaily.on.cc/cnt/finance/20130506/00202_004.html?pubdate=20130506
證監加強規範專業投資者
市場消息透露,證監會有關專業投資者的諮詢文件已接近完成,最快數月內出台。

多項豁免或遭修訂
據了解,有關中介人出售投資產品予專業投資者時,證監會初步建議監管方向或趨向收緊,但未必會對私人配售證券或債券售予專業投資者時,相關招股章程毋須證監會認可這種做法進行大改動,以免窒礙市場發展。
現時證監會對有關專業投資者的監管,當中有關中介人出售投資產品時,若其客戶是專業投資者,可以獲豁免多項規定,例如不需確保向客戶作出建議或招攬行為是合適、不需要與客戶訂立協議書及提供風險披露聲明、不需要向客戶提供有關中介人及僱員的身份與受僱狀況資料等。
不過,專業投資者除有800萬元投資組合總值外,中介人還需要評估及合理信納客戶有專業知識,包括專業投資者每年應進行不少於40宗交易、在相關市場活躍地進行交易最少達兩年、以往曾買賣的投資產品種類及對有關產品所涉及的風險認知等。
消息透露,證監會將諮詢市場對出售產品予專業投資者時,中介人現享有的多項豁免是否合適,以及中介人評估專業人士的專業知識與投資經驗的考慮因素是否要修訂。據了解,證監會未必是簡單「修修補補」,反而可能會建議有一些全新的評估方式。
有證券界人士贊成證監會收緊專業投資者的規定,「可以攔住啲人,令無咁多人做到專業投資者。」他表示,除可做高風險投資外,做專業投資者其實「着數不大」。
無意改動私人配售
不過,投資者學會主席譚紹興認為,這不是放寬或收緊的問題,最大挑戰是如何界定專業投資者,認為不應按一年進行多少次交易來界定,應按交易深度與目的。不過,他同意私人配售不宜改動,因投資者可隨時轉去新加坡或美國市場;800萬元門檻不用改,因與外國差不多。
投資程識:跟炒美股有門路
投資程識:跟炒美股有門路
美國股市近期迭創新高,本港投資者若要跟炒美股,可選擇一些有提供投資美股的股票經紀行。坊間現時就有各式投資平台供投資者選擇。今期「投資程識」為大家精挑細選出五個美股投資網上平台,從佣金收費等方面進行大比併,助你揀選最適合自己的美股交易平台!

| 租/售 |  |
| 租 售 | |
| 樓盤由property.hk提供 | |
我的瀏覽記錄

不過,在進行網上買賣美股前,要先行了解風險,香港股票分析師協會副主席郭思治稱,投資者如經網上平台進行美股交易,首要清楚了解網站交易收費,特別是部分網站會再經中介公司,替客戶進行買賣。
經紀行財政須留意
有別於香港投資者直接買賣港股,交易運作均受監管,如選擇網上投資美股,在網絡安全及其他技術問題上,都要承擔一定風險,如網絡擠塞或影響交易過程。他提醒要加倍留意光顧的美股投資經紀公司的財政狀況,尤其是海外投資經紀,因萬一財政有問題,香港投資者追討損失會更困難。
佣金細節要搞清楚
海外股票網上交易平台以低佣金作招徠,但通常這些銀碼旁邊都會標示一個小數字,額外的收費或限制往往就是在細節中。
E*TRADE劃一佣金9.99美元優惠期截至六月底,客戶須於限期前一次過存入帳戶之現金或美國證券總值不少於5千美元,或一次過把美國證券從其他金融機構轉存到該帳戶,才可獲低佣優惠。嘉信理財在收費詳情中表示交易佣金只需8.95美元,但仔細查閱款項,就會發現用家需額外繳付一項名叫「外國交易費用」的款項,盛惠50美元。兩項開支會綜合顯示為「佣金」。
智能手機當道,只要一機在手,即可以透過手機Apps進行買賣,當中輝立、E*TRADE及TD Ameritrade 在Android Play Store及Apple Store 都可以下載手機交易程式。據Android市場統計顯示,最近30日E*TRADE的下載量最高,有50萬至100萬下載次數;TD Ameritrade有10萬至50萬次。TD Ameritrade 的Apps可以買賣股票、期權、期貨、ETF等;E*Trade可買賣股票、期權及信託基金外,還可以透過手機Apps即時查閱公司的數據及新聞。
網上投資交易平台牽涉大量個人戶口資料私隱,故保安功夫須萬無一失!現時各大網站都各自有一套保安系統,如BOOM就聲稱有六層保安措施,買賣股票時,系統會要求使用者輸入另一組「個人識別號碼」,有別於「登入密碼」,註冊時會以郵件方式獲取。另外,個人資料如銀行戶口細節、出生日期等資料會儲存在一部外界無法連接的專用電腦中,避免容易遭竊取。
Priceline Leads Online Travel, An Increasingly Competitive Space
Priceline Leads Online Travel, An Increasingly Competitive Space
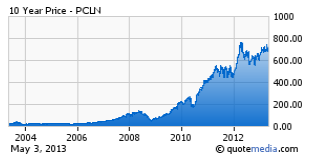
Priceline (PCLN) is one of America's great companies and success stories. It is a very popular online service that helps consumers shop for travel arrangements, and, in turn, for transportation and hospitality businesses to reach their clients. The corporation and its stock are known for generating wealth in recent years, closing today at $724.77, a decade after trading below $10 per share in 2003. As a winner, it may be associated with Apple (AAPL), AutoZone (AZO), or Google (GOOG). While it might be ironic that two out of three of those names also pose increasing threats to Priceline's future prospects, I am in agreement with two of the largest and most respected financial institutions that the company should be viewed favorably by investors.
Here is the ten year chart for PCLN, showing how the stock has performed:
A Barron's article is not optimistic, and cites increasing competition as a concern. It may be considered alongside Deutsche Bank's most recent research note reiterating a Hold rating placed on PCLN since 12/10/12, and providing a price target of $745. Expedia (EXPE) is Priceline's rival, with pressure exerted by TripAdvisor (TRIP), and Orbitz Worldwide(OWW). Concern about Google is widespread. Barron's also adds that:
Wall Street's sanguine expectations mean that the disappointment could be severe if margins slip.
Sure enough, Jim Cramer and his staff at The Street like Priceline. For this article, the research of three highly regarded European firms, that all are also identified with Wall Street, is being utilized to assess the company's investment potential. UBS and Credit Suisse recommend the stock, clearly favoring it to Expedia; and Deutsche Bank's methodology and insight is quite helpful.
UBS (April 1, 2013)
UBS has initiated coverage with an $825 price target and a Buy rating. In sum, it says the company's
Strengths include a strong intent to purchase travel on the part of Priceline's visitors and a reputation as one of the original disruptors of the traditional travel agency model. Offsetting this are increasing competitive pressures in the form of increased marketing spend to drive bookings…In particular, we expect the combination of the Booking.com and Agoda.com to outperform Expedia and the overall global online travel market…Over the next twelve months, we are more biased to the upside.
Priceline operates primarily through four global brands, all of which UBS views favorably:
- Priceline.com - Website known for its Name Your Own Price to North American leisure travelers.
- Booking.com - Global online hotel reservation service.
- Agoda.com - Hotel reservation service primarily focused in Asia-Pacific.
- Rentalcars.com - Global car rental service.
According to UBS,
The bull case around the OTAs (Online Travel Agents) is that they only comprise a mid-single digit percentage of hotel room nights sold on a global basis at present, and therefore there is a multiple year growth trajectory ahead for those businesses. Broadly, we agree...
UBS views the situation through a prism of Margins v. Investment, as Priceline "…Re-deploy(s) margin improvements into driving brand loyalty and more direct site traffic…significant acquisitions to increase international footprint have been made."
UBS is clear, and makes a compelling case that Priceline is a top operation and preferred over Expedia.
Despite the recent efforts of Expedia, on a pure operating basis, we expect the combination of the Booking.com and Agoda.com assets to outperform Expedia and the overall global online travel market from the period of 2012-2017… By 2015, we expect that Expedia will have EBITDA margins of 21.2% and FCF conversion of revenue of 16.3% (increases of 130bps and 80bps from our expected 2013 levels, respectively). During that same time period, we expect that Priceline will have EBITDA margins of 38.8% and FCF conversion of revenue of 31.4% (increases of 140bps and 100bps from 2013 levels, respectively). Also, Priceline lacks exposure to air travel (~2% of revenues) and organized corporate travel, businesses that impact the consolidated margins at Expedia.
Lower exposure to air transport is currently good. UBS adds that
the airline industry has recently become more disciplined in terms of capacity levels, resulting in an uptick for both occupancy and pricing levels…Additionally, given airlines tend to pay a flat fee to the OTAs (while hotels generally pay a percentage of the product price)…OTAs are not able to easily offset the lower airline seating capacity with benefits from improved pricing.
Credit Suisse (April 25, 2013)
Credit Suisse has an $886 Price Target and an Outperform rating. Its research note says,
We continue to believe PCLN shares are reflecting a scenario in which it will suffer online advertising deleverage and operating margin compression without giving the management team credit for finding ROI against what equates to an incremental $500+ million in online advertising spend between 2012/2013.
Paraphrasing Priceline's 10-K (17 of 160), it refers to this issue and risk factor:
Priceline has a need to maintain or enhance consumer awareness and acceptance of brands, and even if successful, it may not be cost-effective. There has been a significant increase in online advertising expense through recent years, which is expected to continue. Online advertising ROIs are down YoY.
Credit Suisse expects an increase from 275,000 properties at the time of its 4Q12 earnings, to over 300,000 properties when it reports:
Suggesting about 44.3% year-over-year growth in inventory… Also, the hotel room night mix is expected to shift away from Europe as our checks also suggest that Agoda.com grew its inventory in the AsiaPac region by 60%+…We have modeled Agoda to grow Gross Travel Bookings by ~45% ex-FX in 1Q13…Among dangers to Priceline's achievement of its $886 target: (1) economic uncertainty: any downturn in consumer sentiment could adversely affect travel bookings; (2) competition: Priceline is subject to intense competition...
Deutsche Bank (4/18/13)
Deutsche bank has had a Hold rating on the stock since 12/10/12, and currently has a $745 price target. Perhaps most pertinent for an options trade:
We expect Priceline to report upside to 1Q consensus and guide conservatively for 2Q13, as usual, the key question comes down to magnitude as buyside expectations are above consensus, and the recent upside has been below average…we expect similar ~300bps margin compression in the guidance, and then start to improve in late 2013 based on management's comments. Overall demand trends [occupancy and Average Daily Rates (ADRs)] in Europe largely remain unchanged from prior quarters, despite some of the macro grumblings following the Cyprus events and currency fluctuations.
The German firm bases its neutral thesis on:
1) Increasing competition from Expedia following its re-platforming,
2) Lower ROI from desktop search, and
3) Google's eventual aggressive move into the space…Google's increasing Hotel Finder push in Europe should be largely benign to financials but could impact sentiment.
The note also says that "Key risks include a slowdown in international travel, currency fluctuations and ADR declines." It is revising down estimates for total 2014 bookings -1% with a -.9% hit to gross margins.
For the clarity and ease of presentation, and also methodology that is agreeable, I currently favor Deutsche Bank's calculations. The firm uses an average of Implied Stock Prices based on (1) forward Adjusted EPS, $791; (2) forward Adjusted EBITDA, $711; and (3) forward FCF, $713 to calculate a 2013 $745 target price. For the purposes of valuing a stock, my preference is to use the following year's figures, and Deutsche Bank's forward estimates based on EPS is $917, on EBITDA is $849, and on FCF is $822. The result of averaging the three, which Deutsche Bank does not do for 2014, is $867.22. Data to produce price targets using the German firm's methods follows:
UBS's figures are:
- $2.44B 2014 FCF estimate, using 51M shares, $47.84/share (its uses a 13x EV/Cash Flow multiple).
- $2.97B 2014 EV estimate, their EV/EBITDA multiple is 12x.
- $47.82 2014 EPS, their multiple is 14.4.
Credit Suisse's figures:
- $2.207B 2014 FCF estimate, using 51M shares, we get $43.28 per share.
- $3.022B 2014 EV estimate, their EV/EBITDA multiple is N/A.
- $42.42 2014 adjusted EPS, their multiple is 16.5.
For the purpose of calculating a consensus, I am using an estimated 51M share count. This allows for the possibility of small buybacks, which is discussed in greater depth later. Without repurchasing, the number of shares outstanding is likely to be closer to 52M. All three firms use different tactics to arrive at their price targets. I am applying their data to part of Deutsche Bank's methodology in order to provide a 2014 consensus using an average of implied stock prices based on each's 2014E FCF and also EPS. This procedure deviates from firms' methods, which in turn are unique to each other. For example, it does not include Credit Suisse's Discounted Cash Flows and 2018E Terminal Value, or UBS's emphasis on Enterprise Value.
Forward Estimates
|
UBS
|
Credit Suisse
|
Deutsche Bank
|
2014 Free Cash Flow per Share
|
$47.84 (5.21% Yield)*
|
$43.28 (5.21% Yield)*
|
$45.23 (5.5% Target Yield)
|
2014 Earnings Per Share
|
$47.82 (14.4x)
|
$42.42 (16.5x)
|
$45.83 (20x)
|
2014 Target
|
($918.23+$688.61)/2 = $803.42
|
($830.71+699.93)/2 =$765.32
|
($917+$822)/2 = $869.50
|
Firm's Actual Target
|
$825 (12 months)
|
$886 (12 months)
|
$867.22 (applying 2014 estimates to 2013 methods)
|
Consensus (2014 Calculated Targets / Actual Target price)
|
$812.75 / $859.41
| ||
Sources: Current research notes for April, 2013. *yield calculation extrapolated and based on 5/3/13 closing share price of $724.77 and firm's 2013E FCF
| |||
I am comfortable using $812.75 as a 12 month price target for Priceline in consideration of these three banks' data and estimates. There is 12% upside from the current $724.77 price, and it is likely conservative, as it is lower than each of their actual projections. As much can happen in the course of a year, closer examination of fundamentals is needed. Further, confidence pertaining to Priceline's future margins is lacking. Apple needs results, having guided lightly. I think it could be nearly as formidable an entrant as Google.
Search engine algorithm changes could negatively impact Priceline's relative appearance in results, potentially decreasing traffic to sites and resulting revenue. Additionally, increased competition for key words could drive pay-per-click pricing higher, leading to higher traffic acquisition costs. Priceline obtains "Significant revenue through pay-per-click advertising campaigns on Internet search engines…(p. 23 of 160)." Google has launched a flight search tool that excludes OTAs within search results (p. 16 of 160). Current and potential competitors may be able to leverage search or mobile device businesses (p. 15 of 160). Apple, for example, has a new patent for "iTravel," a mobile app allowing a traveler to check in for a reservation, and offers "Passbook," a virtual wallet app that holds tickets, passes, and gift cards (Source: Priceline 10-K).
Also, some suppliers may offer exclusive product offerings and rewards programs at the supplier-owned sites only, which could make direct booking a more attractive option to traveler customers. One example of this threat is Room Key, an online hotel reservation service intended product launched by Choice Hotels International (CHH), Hilton Worldwide, Hyatt (H), InterContinental Hotels Group (IHG),Wyndham Hotel Group (WYN), Marriott (MAR), La Quinta andMillennium, to drive consumers directly to the merchants' own web sites (10-K 16 of 160).
However, UBS
Believe(s) Priceline presents a compelling risk/reward at current valuations given [its] above industry growth forecasts and the potential for cash returns to shareholders (e.g., buybacks) following the close of the pending Kayak acquisition.
It is the only one of the three firms to explore the possibility of capital returns, and specifically repurchasing, in its most recent research note. In November, 2012, Priceline spent $1.3B in common stock and $500M in cash to acquire Kayak, and the deal is expected to close during the first half of 2013 (10-K 45 of 160). For its "Upside case scenario," UBS projects $2B in buybacks changing the outstanding share count from 51M to 48M in 2014. A review of Priceline's past share repurchase activity leads me to believe that this is optimistic.
As of December 31, 2012, we had remaining authorizations from our Board of Directors to repurchase $459.2 million of our common stock. We may from time to time make additional repurchases of our common stock, depending on prevailing market conditions, alternate uses of capital, and other factors (10-K 62 of 160).
Here is a table showing pertinent data in recent years:
Priceline Stockholders' Equity & Share Repurchase Data
(Numbers in 1,000s)
| ||||
2009
|
2010
|
2011
|
2012
| |
Treasury Stock Balance (Dec. 31)
|
(6,865)
|
(7,241)
|
(7,780)
|
(8,185)
|
Common Stock Balance (Dec. 31)
|
52,446
|
56,567
|
57,579
|
58,056
|
Stock-based Compensation and Payments
|
N/A
|
68,396
|
66,194
|
72,035
|
Repurchase of Common Stock
|
N/A
|
(129,445)
|
(163,171)
|
(257,021)
|
Source: Priceline 2012 10-K pp (81-2 of 160)
| ||||
Let me remark that UBS recently released a statement saying that a significant return of cash to shareholders could result in Apple's share price increasing 10%. The company's share price has increased from the high $390 range to over $440 after announcing a record buyback during its Report. UBS could be accurate again, it just does not seem to be widely held position.
Also, per the 10-K (41 - 42 of 160), Priceline:
Experienced strong year-over-year growth in recent years, though that growth has generally decelerated. For example, in the fourth quarter of 2012, our hotel room night growth was 38%, a substantial deceleration from 53% in the fourth quarter of 2011…We expect the long term deceleration trend to continue, and we therefore expect to experience further deceleration in growth rates in the first quarter of 2013 and beyond.
Priceline is reporting First Quarter, 2013 earnings on Thursday, May 9th. Anyone who has read my articles knows that I like to consider option trades to take advantage of similar events. It is worth the time to describe what may be a terrific volatility skew, alongside a long term investment opportunity.
For the immediate future, I am inclined to adopt Deutsche Bank's view calling for strong earnings and conservative guidance. However, in agreement with UBS and Credit Suisse, competition from Expedia is probably exaggerated. Further, Google's and Apple's entry into the industry is more relevant to results in 2014 and after. Any buyback announcement is not forecast until after completion of the Kayak acquisition. Thus, the share price can increase dramatically because of earnings and guidance, though review on Friday and over the weekend is likely to proceed that type of buying. For shareholders, margin issues may be the foremost immediate concern, though Credit Suisse offers comfort.
A May 10, 2013 weekly option can be sold. The most time value can be obtained for it on Monday. However, an increase in implied volatility ("IV") throughout the week may lead to a higher price in following days; though the price for May 18 weeklies can increase also. Records show IV spiking above 50% at this time last year, and it is currently at 35.96%. Priceline does not report until after the close on Thursday, so the real worry is that the option is not assigned on Friday before it expires. With this in mind, the share price can change throughout the week, and I am inclined to sell an option that is far enough out of the money on Monday to lower the risk.
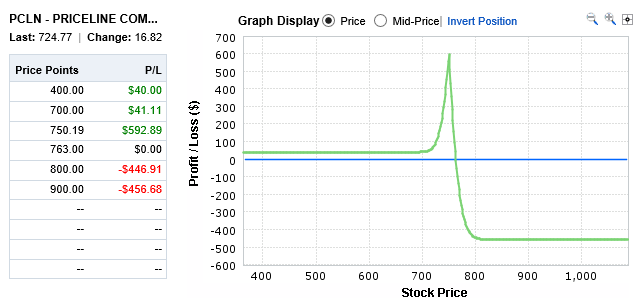
A May 10 $750 call should bring in $13.70 and a May 18 $755 is slightly cheaper at $13.30. The options show wide spreads, so liquidity and execution could be issues. However, if a trade goes through at the specified prices, then a $40 credit would be the minimum profit in all scenarios, except a rise in share price above $750.19. Seeking Alpha lists the 52 week high at $752.46, and a price above $750 at the conclusion of next week would be surprising. Here is a table and graphic showing projected profit and loss at close on Friday the 10th. Profit projections may be high, though a 20% IV collapse is assumed. However, chances are the $755 call can be kept for the beginning of the following week to watch for the stock to rise above the strike price, or sold. The maximum loss shown is -$456, almost $200 below the share price.
(click to enlarge)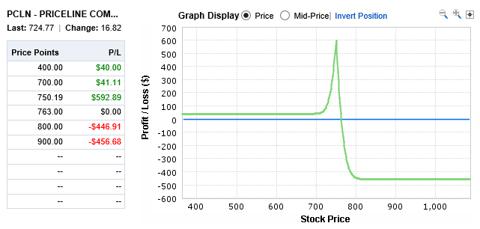
Priceline offers plenty to investors. Prospects for long term, international growth are obvious, though so is the competition. There is also the potential to rapidly earn profits through an options trade, which can be a lucrative and low risk course of action.
Subscribe to:
Posts (Atom)