http://seekingalpha.com/article/1354171-10-piotroski-stocks-to-beat-the-market?source=feed
10 Piotroski Stocks To Beat The Market
Disclosure: I have no positions in any stocks mentioned, and no plans to initiate any positions within the next 72 hours.
I have searched for a screening method, which has proven to perform much better than the main indexes of the U.S. stock markets. The following screen by Portfolio123, which draws inspiration from the work of the well-known investor, Joseph Piotroski, is such a screen. Nonetheless, the screening method should only serve as a basis for further research. Joseph Piotroski is an American professor who specializes in accounting and financial reporting issues, and an active value-based investor.
The screen's formula requires all stocks to comply with all following demands:
- Stock is not traded over-the-counter.
- Earnings per Share trailing twelve months above zero.
- Operating Income above zero.
- Operating cash flow per share above zero.
- Gross margin improved in the past year.
- Operating cash flow per share above EPS.
- Total debt to assets ratio down in past year.
- Current ratio improved in the past year.
- Asset turnover improved in the past year.
- Return on assets improved in the past year.
- Number of outstanding shares did not rise in the past year.
- The 10 stocks with the highest gross margin among all the stocks that complied with the first eleven demands.
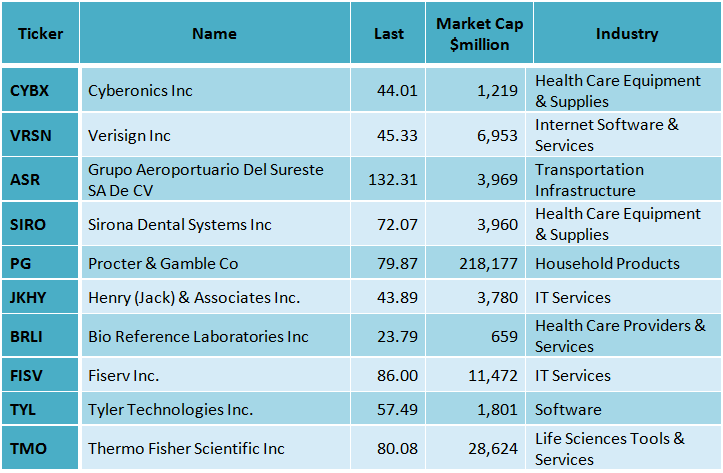
I used the Portfolio123's powerful screener to perform the search and to run the back-tests. All the data for this article were taken from Portfolio123. After running this screen on April 19, 2013, before the market open, I discovered the following ten stocks: Cyberonics Inc (CYBX), Verisign Inc (VRSN), Grupo Aeroportuario Del Sureste SA De CV (ASR), Sirona Dental Systems Inc (SIRO), Procter & Gamble Co (PG), Henry (JACK) & Associates Inc. (JKHY), Bio Reference Laboratories Inc (BRLI), Fiserv Inc. (FISV), Tyler Technologies Inc (TYL) and Thermo Fisher Scientific Inc (TMO).
The table below presents the 10 companies, their last price, their market cap and their industry.
(click to enlarge)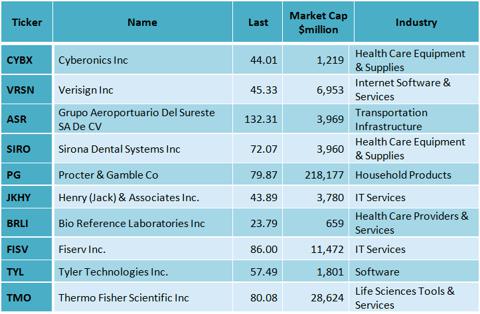
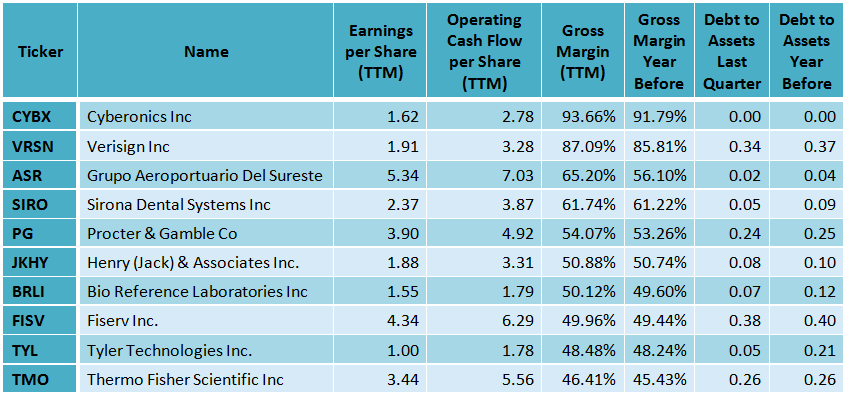
The table below presents the earnings per share for the trailing twelve months (TTM), the operating cash flow per share, the gross margin, the gross margin a year before, the debt to assets ratio for the last quarter and for the year before for the 10 companies.
(click to enlarge)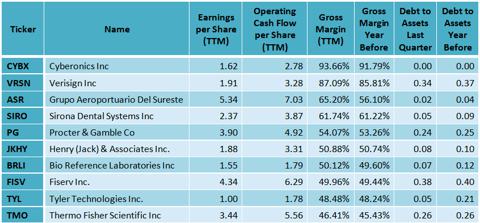
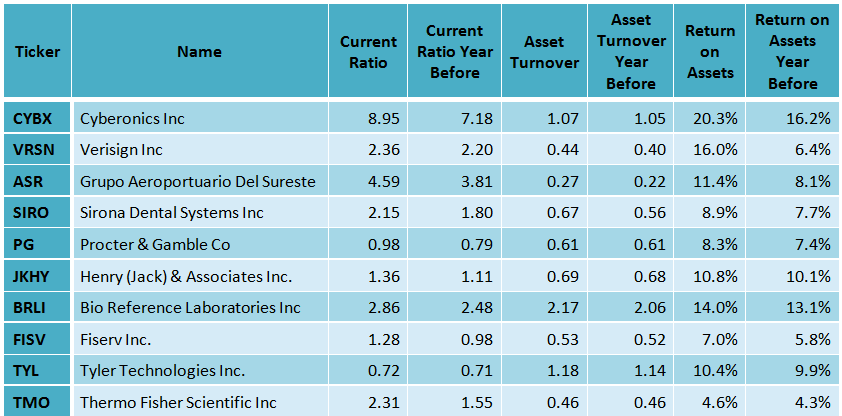
The table below presents the current ratio, the current ratio a year before, the asset turnover, the asset turnover a year before, the return on assets and the return on assets a year before for the ten companies.
(click to enlarge)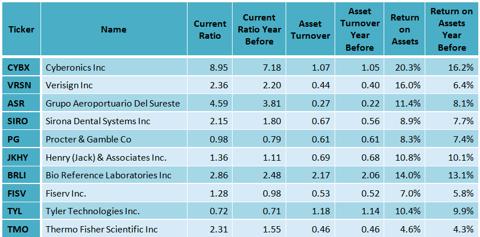
Back-testing
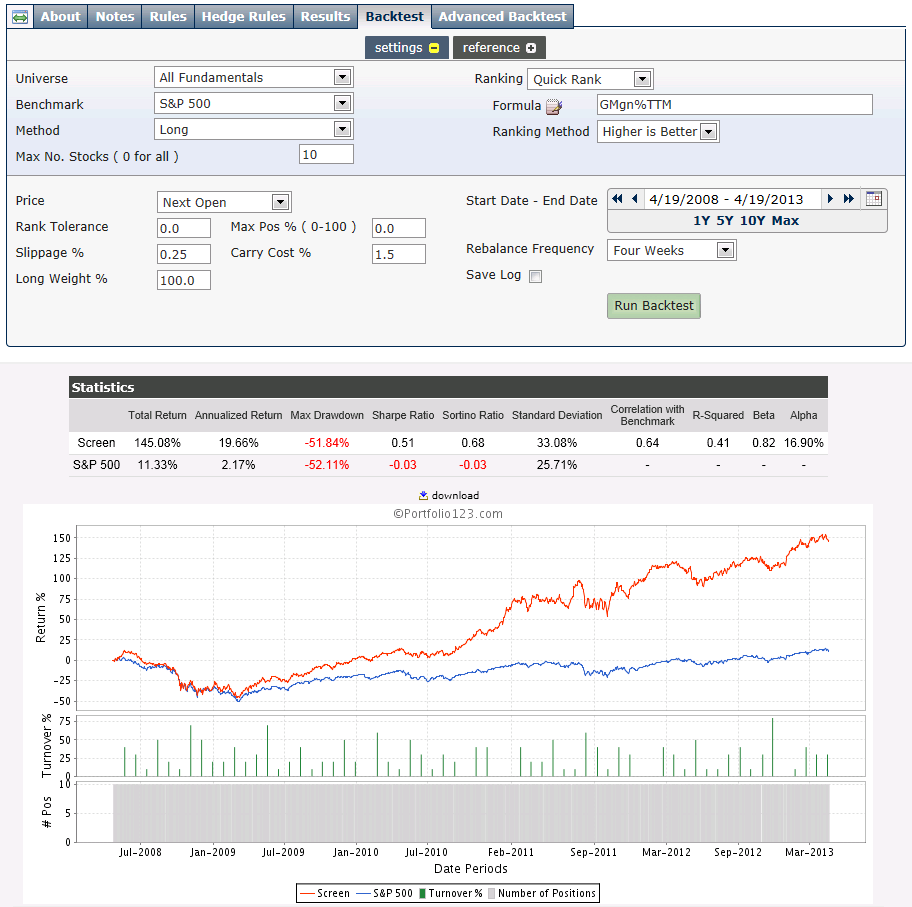
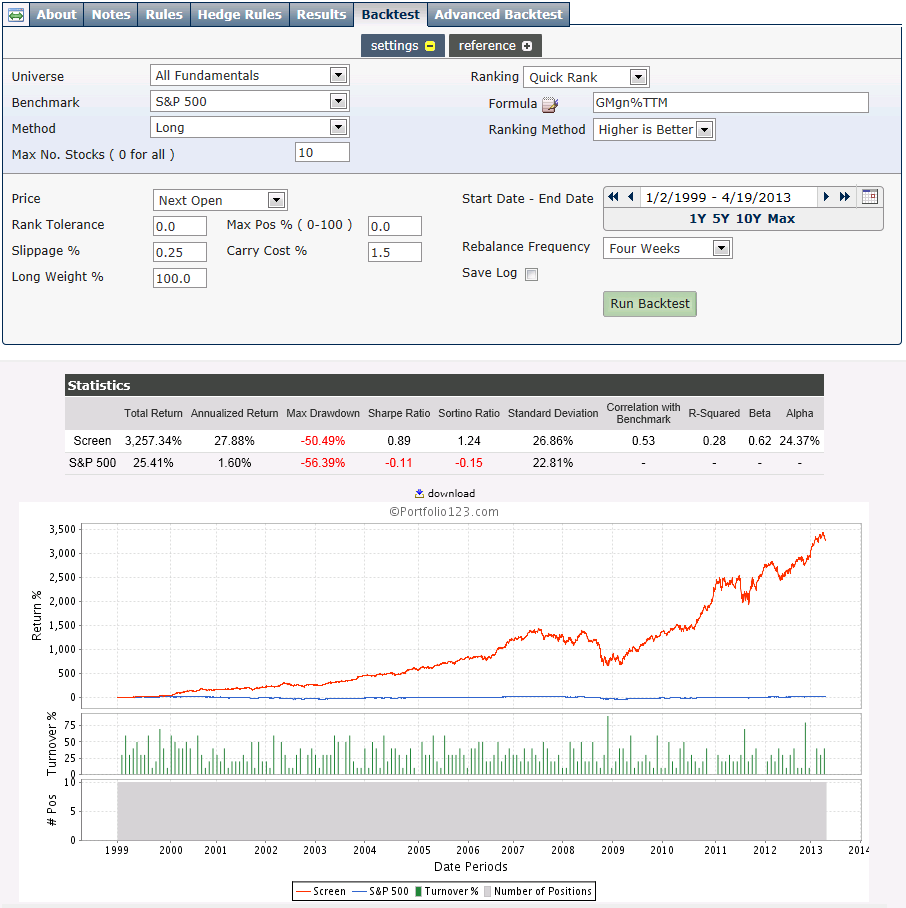
In order to find out how such a screening formula would have performed during the last year, last five years and last 14 years, I ran the back-tests, which are available by the Portfolio123's screener.
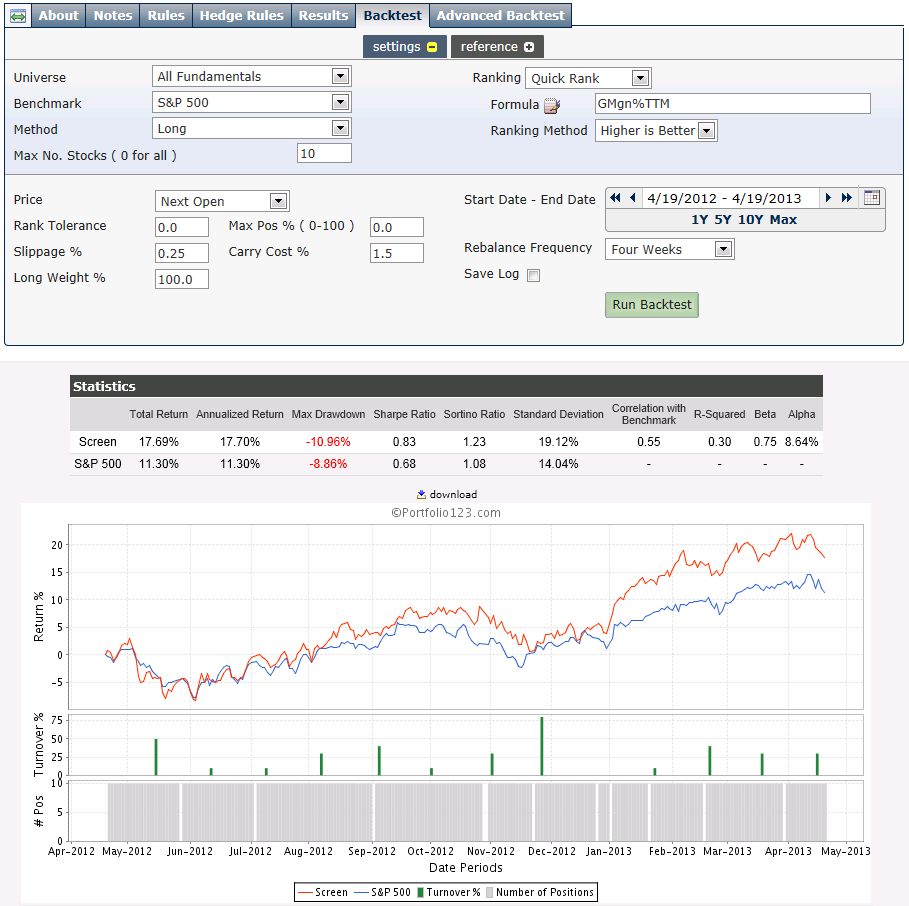
The back-test takes into account running the screen every four weeks and replacing the stocks that no longer comply with the screening requirement with other stocks that comply with the requirement. The theoretical return is calculated in comparison to the benchmark (S&P 500), considering 0.25% slippage for each trade and 1.5% annual carry cost (broker cost). The back-tests results are shown in the charts and the tables below.
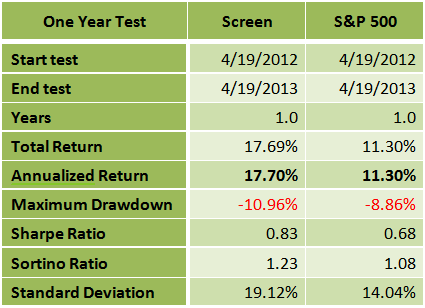
One year back-test
(click to enlarge)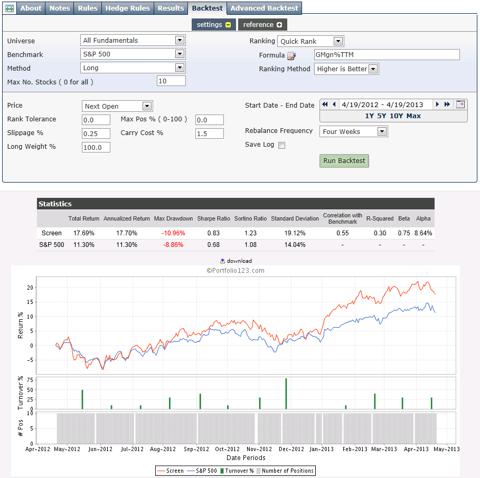
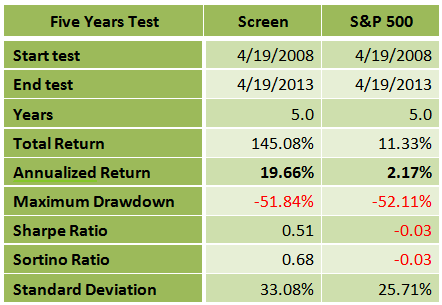
Five years back-test
(click to enlarge)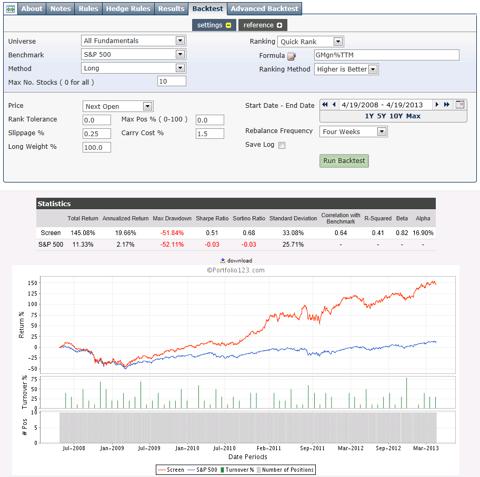
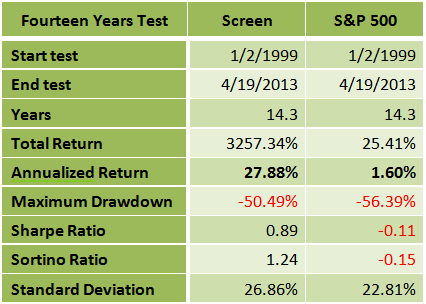
Fourteen years back-test
(click to enlarge)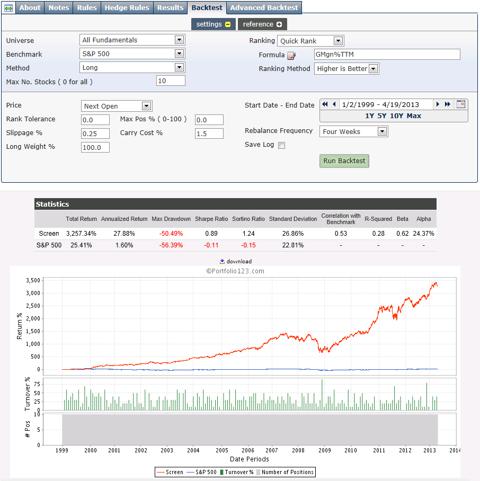
Summary
The Piotroski inspired screen has given much better returns during the last year, the last five years and the last 14 years than the S&P 500 benchmark. The Sharpe ratio, which measures the ratio of reward to risk, was also much better in all the three tests. Although the past guarantees nothing, it does provide insight into how this screen has performed under various economic conditions over varying time frames.
No comments:
Post a Comment