http://seekingalpha.com/article/1358371-3-strong-yielding-russell-1000-stocks-that-have-hiked-payouts-by-at-least-7-for-5-years?source=feed
3 Strong-Yielding Russell 1000 Stocks That Have Hiked Payouts By At Least 7% For 5 Years
Disclosure: I am long STX.
I have searched for very profitable companies that are included in the Russell 1000 index that pay rich dividends, and that have raised their payouts significantly each year.
The Russell 1000 Index measures the performance of the large-cap segment of the U.S. equity universe. It is a subset of the Russell 3000® Index and includes approximately 1000 of the largest securities based on a combination of their market cap and current index membership. The Russell 1000 represents approximately 92% of the U.S. market. The Russell 1000 Index is constructed to provide a comprehensive and unbiased barometer for the large-cap segment and is completely reconstituted annually to ensure new and growing equities are reflected.
I have elaborated a screening method, which shows stock candidates following these lines. Nonetheless, the screening method should only serve as a basis for further research. All the data for this article were taken from Yahoo Finance and finviz.com.
The screen's formula requires all stocks to comply with all following demands:
- Dividend yield is greater than 4.40%.
- The payout ratio is less than 75%.
- The annual rate of dividend growth over the past five years is greater than 7%.
- Trailing P/E is less than 15.
- Forward P/E is less than 13.
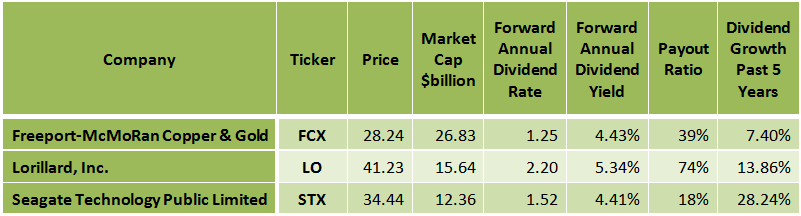
After running this screen on April 21, 2013, I discovered the following three stocks:
(click to enlarge)
(click to enlarge)
(click to enlarge)
(click to enlarge)

Freeport-McMoRan Copper & Gold Inc. (FCX)
Freeport-McMoRan Copper & Gold Inc. engages in the exploration of mineral resource properties. The company primarily explores for copper, gold, molybdenum, cobalt, silver, and other metals, such as rhenium and magnetite.
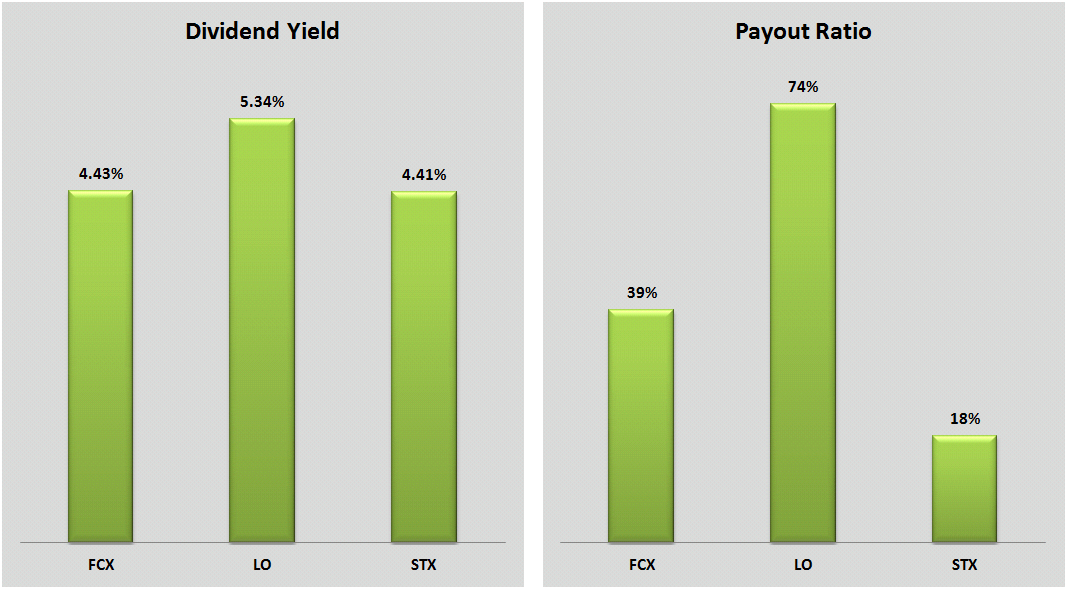
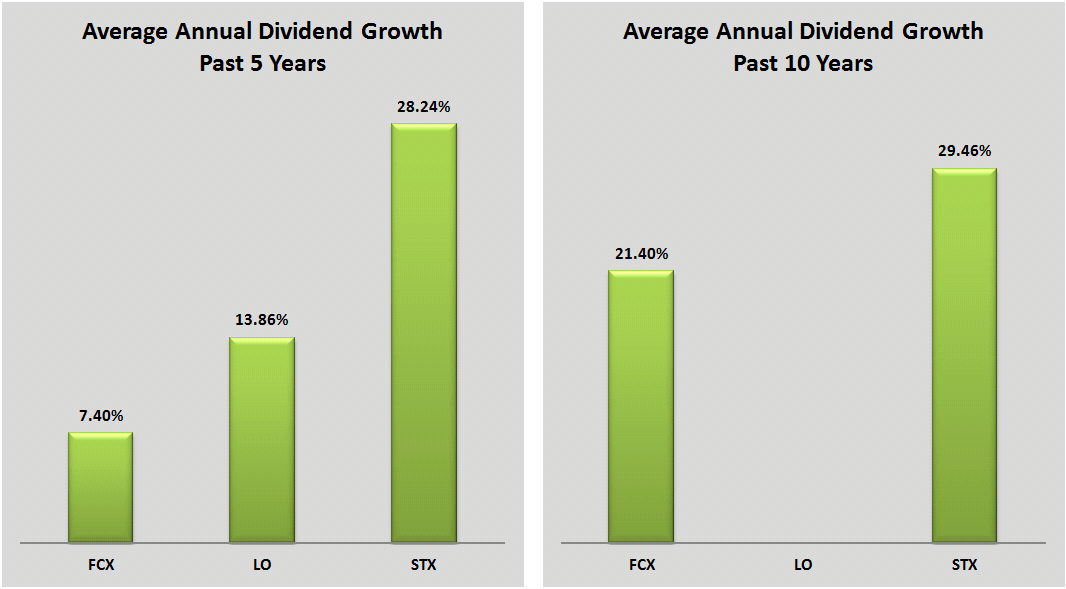
Freeport-McMoRan has a very low debt (total debt to equity is only 0.20), and it has a very low trailing P/E of 8.85 and a very low forward P/E of 6.11. The forward annual dividend yield is quite high at 4.43%, and the payout ratio is only 39%. The annual rate of dividend growth over the past five years was quite high at 7.40%, and over the last ten years was very high at 21.40%.
The FCX stock is trading 33.6% below its 52-week high, and has 41.4% upside potential based on the consensus mean target price of $39.93.
On April 18, Freeport-McMoRan reported its first-quarter 2013 financial results, which beat EPS expectations by $0.02 and beat on revenues. Net income attributable to common stock for first-quarter 2013 was $648 million, $0.68 per share, compared with net income of $764 million, $0.80 per share, for first-quarter 2012. Consolidated sales from mines for first-quarter 2013 totaled 954 million pounds of copper, 214 thousand ounces of gold and 25 million pounds of molybdenum, compared with 827 million pounds of copper, 288 thousand ounces of gold and 21 million pounds of molybdenum for first-quarter 2012.
In the report, James R. Moffett, Chairman of the Board, and Richard C. Adkerson, President and Chief Executive Officer, said:
Our first-quarter results reflect our focus on strong and safe production, aggressive cost management and advancing financially attractive projects to grow our copper production, increase cash flows and provide strong returns for shareholders. We also completed attractive financing transactions during the quarter, providing low-cost debt to fund the pending oil and gas acquisitions. We look forward to completing the transactions in the second quarter and to executing our strategy of developing long-term resources to generate long-term value for shareholders through expanded investment opportunities.
The compelling valuation metrics, the 41.4% upside potential based on the consensus mean target price of $39.93, the rich dividend and the fact that the company consistently has raised dividend payments are all factors that make FCX stock quite attractive.
(click to enlarge)
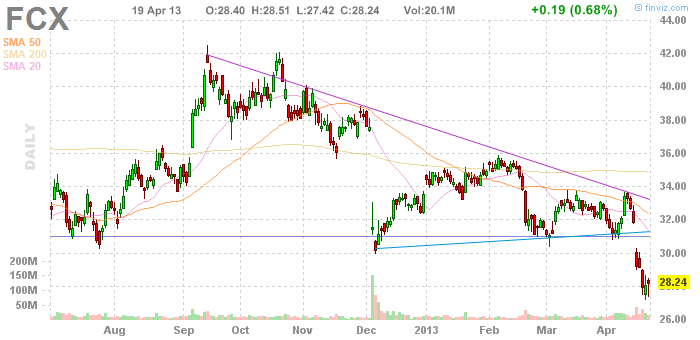
Chart: finviz.com
Lorillard, Inc. (LO)
Lorillard, Inc. manufactures and sells cigarettes in the United States. The company operates through two segments, Cigarettes and Electronic Cigarettes.
Lorillard has a very low trailing P/E of 14.67 and a very low forward P/E of 12.20. The average annual earnings growth estimates for the next 5 years is quite high at 9.10%. The forward annual dividend yield is very high at 5.34%, and the payout ratio is at 74%. The annual rate of dividend growth over the past five years was very high at 13.86%.
The LO stock is trading 0.98% above its 20-day simple moving average, 2.91% above its 50-day simple moving average, and 4.01% above its 200-day simple moving average. That indicates a short-term, mid-term and long-term uptrend.
Lorillard will report its latest quarterly financial results on April 24. LO is expected to post a profit of $0.64 a share, a 10.3% rise from the company's actual earnings for the same quarter a year ago. The reported results will probably affect the stock price in the short term.
All these factors -- the very low multiples, the rich dividend, the fact that the company consistently has raised dividend payments and the fact that the stock is in an uptrend -- make LO stock quite attractive.
(click to enlarge)

Chart: finviz.com
Seagate Technology Public Limited Company (STX)
Seagate Technology Public Limited Company designs, manufactures, markets and sells hard disk drives for enterprise storage, client compute, and client non-compute market applications worldwide.
Seagate has an extremely low trailing P/E of 4.55 and a very low forward P/E of 6.30. The price to free cash flow for the trailing 12 months is very low at 4.04, and the price-to-sales ratio is also very low at 0.76. The forward annual dividend yield is quite high at 4.41%, and the payout ratio is only 18%. The annual rate of dividend growth over the past five years was very high at 28.24%, and over the last ten years was also very high at 29.46%.
Seagate will report its latest quarterly financial results on May 1. STX is expected to post a profit of $0.84 a share, a 56% decline from the company's actual earnings for the same quarter a year ago. The reported results will probably affect the stock price in the short term.
Despite the expected earnings decline, the very cheap valuation metrics, the rich dividend and the fact that the company consistently has raised dividend payments are all factors that make STX stock quite attractive.
(click to enlarge)

Chart: finviz.com